Using resources effectively
Overview
Teaching: 5 min
Exercises: 20 minQuestions
How do I choose the correct resources for my jobs?
How do I understand what resources my jobs are using?
Objectives
Understand how perform basic benchmarking to choose resources efficiently.
We now know virtually everything we need to know about getting stuff onto and using a cluster. We can log on, submit different types of jobs, use preinstalled software, and install and use software of our own. What we need to do now is use the systems effectively. To do this we need to understand the basics of benchmarking. Benchmarking is essentially performing simple experiments to help understand how the performance of our work varies as we change the properties of the jobs on the cluster - including input parameters, job options and resources used.
Our example
In the rest of this episode, we will use an example parallel application that sharpens an input image. Although this is a toy problem, it exhibits all the properties of a full parallel application that we are interested in for this course.
The main resource we will consider here is the use of compute core time as this is the resource you are usually charged for on HPC resources. However, other resources - such as memory use - may also have a bearing on how you choose resources and constrain your choice.
TODO: Add in link to more information on what sharpen actually does for those that are interested.
For those that have come across HPC benchmarking before, you may be aware that people often make a distinction between strong scaling and weak scaling:
- Strong scaling is where the problem size (i.e. the application) stays the same size and we try to use more cores to solve the problem faster.
- Weak scaling is where the problem size increases at the same rate as we increase the core count so we are using more cores to solve a larger problem.
Both of these approaches are equally valid uses of HPC. This example looks at strong scaling.
Before we work on benchmarking, it is useful to define some terms for the example we will be using
- Program The computer program we are executing (
sharpenin the examples below) - Application The combination of computer program with particular input parameters
(
sharpenwithfuzzy.pgmin our example below)
Accessing the software and input
The sharpen program has been preinstalled on ARCHER, you can access it with the
command:
module load epcc-training/sharpen
Once you have loaded the module, you can access the program as sharpen. You will also
need to get a copy of the input file for this application. To do this, copy it from the
central install location to your directory with (note you must have loaded the
sharpen module as described above for this to work):
yourUsername@eslogin001:~> cp $SHARPEN_DATA/fuzzy.pgm .
Baseline: running in serial
Before starting to benchmark an application to understand what resources are best to use, you need a baseline performance result. In more formal benchmarking, your baseline is usually the minimum number of cores or nodes you can run on. However, for understanding how best to use resources, as we are doing here, your baseline could be the performance on any number of cores or nodes that you can measure the change in performance from.
Our sharpen application is small enough that we can run a serial (i.e. using a single core)
job for our baseline performance so that is where we will start
Run a single core job
Write a job submission script that runs the
sharpenapplication on a single core. You will need to take an initial guess as to the walltime to request to give the job time to complete. Submit the job and check the contents of the STDOUT file to see if the application worked or not.Solution
Creating a file called
submit_sharpen.pbs:#!/bin/bash #PBS -N sharpen #PBS -l select=1 #PBS -l walltime=0:5:0 #PBS -A tc011 module load epcc-training/sharpen # Change to the directory that the job was submitted from cd $PBS_O_WORKDIR # Run application using a single process (i.e. in serial) aprun -n 1 sharpenSubmit with:
yourUsername@eslogin001:~> qsub submit_sharpen.pbsOutput in STDOUT should look something like:
Input file is: fuzzy.pgm
Image size is 564 x 770
Using a filter of size 17 x 17
Reading image file: fuzzy.pgm
... done
Starting calculation ...
On core 0
... finished
Writing output file: sharpened.pgm
... done
Calculation time was 5.400482 seconds
Overall run time was 5.496556 seconds
Once your job has run, you should look in the output to identify the performance. Most
HPC programs should print out timing or performance information (usually somewhere near
the bottom of the summary output) and sharpen is no exception. You should see two
lines in the output that look something like:
Calculation time was 5.579000 seconds
Overall run time was 5.671895 seconds
You can also get an estimate of the overall run time from the final job statistics. If
we look at how long the finished job ran for, this will provide a quick way to see
roughly what the runtime was. This can be useful if you want to know quickly if a
job was faster or not than a previous job (as oyu do not have to find the output file
to look up the performance) but the number is not as accurate as the performance recorded
by the application itself and also includes static overheads from running the job
(such as loading modules and startup time) that can skew the timings. To do this on
use qstat -x -f with the job ID, e.g.:
yourUsername@eslogin001:~> qstat -x -f 12345
Job Id: 7099670.sdb
    Job_Name = sharpen
    Job_Owner = tc011dsh@eslogin1-ldap
    resources_used.cpupercent = 0
    resources_used.cput = 00:00:00
    resources_used.mem = 0kb
    resources_used.ncpus = 24
    resources_used.vmem = 0kb
    resources_used.walltime = 00:00:11
    job_state = F
    queue = R7090548
    server = sdb
    Account_Name = tc011
    Checkpoint = u
    ctime = Fri Jun 26 17:32:35 2020
    Error_Path = eslogin1-ldap:/work/tc011/tc011/tc011dsh/sharpen.e7099670
    exec_host = mom2/177*24
    exec_vnode = (archer_2907:ncpus=24)
    Hold_Types = n
    Join_Path = n
    Keep_Files = n
    Mail_Points = a
    mtime = Fri Jun 26 17:33:17 2020
    Output_Path = eslogin1-ldap:/work/tc011/tc011/tc011dsh/sharpen.o7099670
    Priority = 0
    qtime = Fri Jun 26 17:32:35 2020
    Rerunable = False
    Resource_List.mpiprocs = 24
    Resource_List.ncpus = 24
    Resource_List.nodect = 1
    Resource_List.place = free
    Resource_List.select = 1:mpiprocs=24:ompthreads=1:serial=false:ppn=false:vn
        type=cray_compute
    Resource_List.walltime = 00:05:00
    stime = Fri Jun 26 17:33:02 2020
    session_id = 13597
    jobdir = /home/tc011/tc011/tc011dsh
    substate = 92
    Variable_List = PBS_O_SYSTEM=Linux,NUM_PES=24,PBS_O_SHELL=/bin/bash,
        PBS_O_HOME=/home/tc011/tc011/tc011dsh,PBS_O_LOGNAME=tc011dsh,
    ...
Viewing the sharpened output image
To see the effect of the sharpening algorithm, you can view the images using the display program from the ImageMagick suite.
display sharpened.pgmType
qin the image window to close the program. To view the image you will need an X window client installed and you will have to have logged into ARCHER with thessh -Yoption to export the display back to your local system. If you are using Windows, the MobaXterm program provides a login shell with X capability. If you are using macOS, then you will need to install XQuartz. If you are using Linux then X should just work!
Running in parallel and benchmarking performance
We have now managed to run the sharpen application using a single core and have a baseline
performance we can use to judge how well we are using resources on the system.
Note that we also now have a good estimate of how long the application takes to run so we can provide a better setting for the walltime for future jobs we submit. Lets now look at how the runtime varies with core count.
Benchmarking the parallel performance
Modify your job script to run on multiple cores and evaluate the performance of
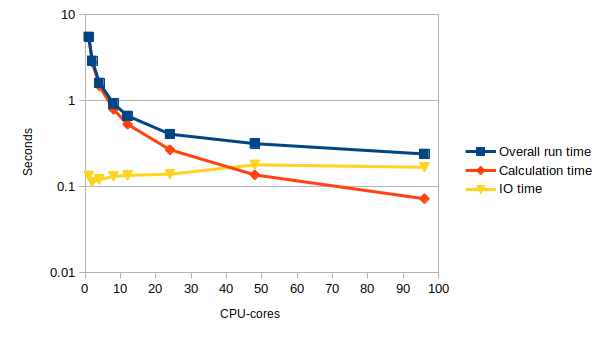
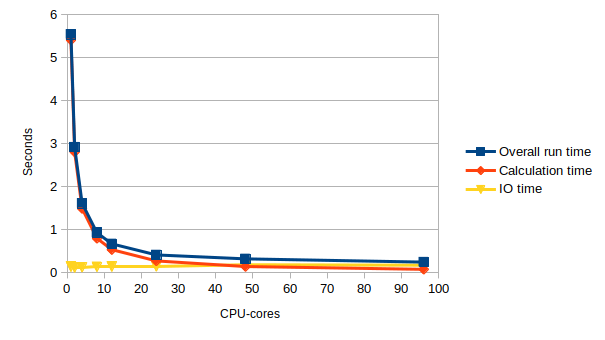
sharpenon a variety of different core counts and use multiple runs to complete a table like the one below.If you examine the log file you will see that it contains two timings: the total time taken by the entire program (including IO) and the time taken solely by the calculation. The image input and output is not parallelised so this is a serial overhead, performed by a single processor. The calculation part is, in theory, perfectly parallel (each processor operates on different parts of the image) so this should get faster on more cores. The IO time in the table below is the difference between the calculation time and the overall run time; the total core seconds is the calculation time multiplied by the number of cores.
Cores Overall run time (s) Calculation time (s) IO time (s) Total core seconds 1 (serial) 2 4 8 12 24 48 96 Look at your results – do they make sense? Given the structure of the code, you would expect the IO time to be roughly constant and the performance of the calculation to increase linearly with the number of cores: this would give a roughly constant figure for the total core time. Is this what you observe?
Solution
Cores Overall run time (s) Calculation time (s) IO time (s) Total core seconds 1 5.544246 5.410836 0.13341 5.410836 2 2.917452 2.804676 0.112776 5.609352 4 1.609339 1.48881 0.120529 5.95524 8 0.924753 0.793237 0.131516 6.345896 12 0.665114 0.530394 0.13472 6.364728 24 0.40722 0.268055 0.139165 6.43332 48 0.315862 0.136599 0.179263 6.556752 96 0.239602 0.071997 0.167605 6.911712
Understanding the performance
Now we have some data showing the performance of our application we need to try and draw some useful conclusions as to what the most efficient set of resources are to use for our jobs. To do this we introduce two metrics:
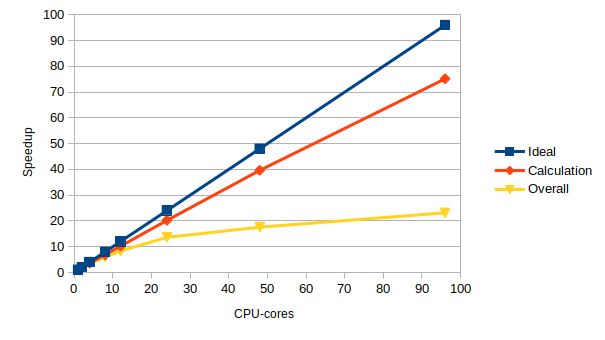
- Speedup The ratio of the baseline runtime (or runtime on the lowest core count) to the runtime at the specified core count. i.e. baseline runtime divided by runtime at the specified core count.
- Ideal speedup The expected speedup if the application showed perfect scaling. i.e. if you double the number of cores, the application should run twice as fast.
- Parallel efficiency The percentage of ideal speedup actually obtained for a given core count. This gives an indication of how well you are exploiting the additional resources you are using.
We will now use our performance results to compute these two metrics for the sharpen application and use the metrics to evaluate the performance and make some decisions about the most effective use of resources.
Computing the speedup and parallel efficiency
Use your Overall run times from above to fill in a table like the one below.
Cores Overall run time (s) Ideal speedup Actual speedup Parallel efficiency 1 (serial) 2 4 8 12 24 48 96 Given your results, try to answer the following questions:
- What is the core count where you get the most efficient use of resources, irrespective of run time?
- What is the core count where you get the fastest solution, irrespective of efficiency?
- What do you think a good core count choice would be for this application that balances time to solution and efficiency? Why did you choose this option?
Solution
The table below gives example results for ARCHER based on the example runtimes given in the solution above.
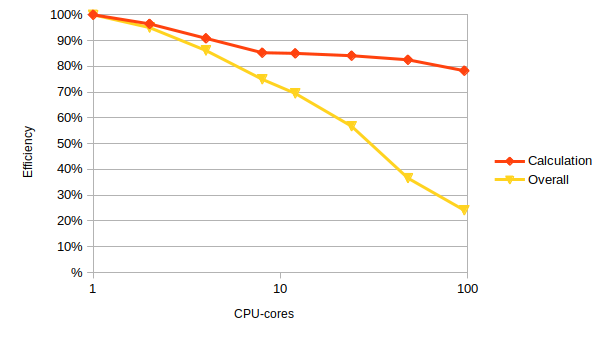
Cores Overall run time (s) Ideal speedup Actual speedup Parallel efficiency 1 5.544246 1 1 100% 2 2.917452 2 1.90037265394598 95% 4 1.609339 4 3.44504545033706 86% 8 0.924753 8 5.99538038806038 75% 12 0.665114 12 8.33578303869713 69% 24 0.40722 24 13.614866656844 57% 48 0.315862 48 17.5527477189406 37% 96 0.239602 96 23.1393978347426 24% What is the core count where you get the most efficient use of resources?
Just using a single core is the cheapest (and always will be unless your speedup is better than perfect – “super-linear” speedup). However, it may not be possible to run on small numbers of cores depending on how much memory you need or other technical constraints.
Note: on most high-end systems, nodes are not shared between users. This means you are charged for all the CPU-cores on a node regardless of whether you actually use them. Typically we would be running on many hundreds of CPU-cores not a few tens, so the real question in practice is: what is the optimal number of nodes to use?
What is the core count where you get the fastest solution, irrespective of efficiency?
96 cores gives the fastest time to solution.
The fastest time to solution does not often make the most efficient use of resources so to use this option, you may end up wasting your resources. Sometimes, when there is time pressure to run the calculations, this may be a valid approach to running applications.
What do you think a good core count choice would be for this application to use?
24 cores is probably the most efficient number of cores to use with a parallel efficiency of 57%.
Usually, the best choice is one that delivers good parallel efficiency with an acceptable time to solution. Note that acceptable time to solution differs depending on circumstances so this is something that the individual researcher will have to assess. Good parallel efficiency is often considered to be 70% or greater though many researchers will be happy to run in a regime with parallel efficiency greater than 60%. As noted above, running with worse parallel efficiency may also be useful if the time to solution is an overriding factor.
Excluding the IO overhead
Now use your Calculation times (not the overall run times) to compute the speedup and efficiency. How well do you think the calculation part has been parallelised?
Solution
The table below gives example results for ARCHER based on the example runtimes given in the solution above.
1 5.410836 1 1 100% 2 2.804676 2 1.92921963178635 96% 4 1.48881 4 3.63433614766156 91% 8 0.793237 8 6.82120980236676 85% 12 0.530394 12 10.2015407414111 85% 24 0.268055 24 20.1855440114902 84% 48 0.136599 48 39.6110952495992 83% 96 0.071997 96 75.1536314013084 78%
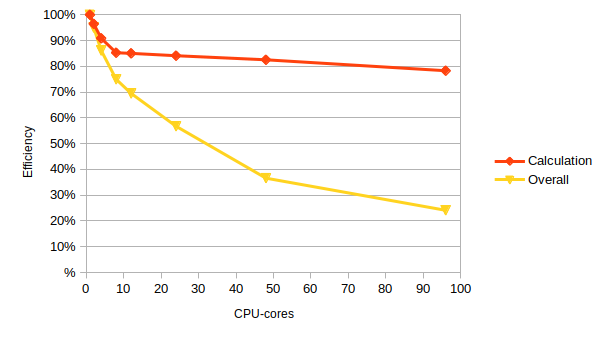
wibble
Tips
Here are a few tips to help you use resources effectively and efficiently on HPC systems:
- Know what your priority is: do you want the results as fast as possible or are you happy to wait longer but get more research for the resources you have been allocated?
- Use your real research application to benchmark but try to shorten the run so you can turn around your benchmarking runs in a short timescale. Ideally, it should run for 10-30 minutes; short enough to run quickly but long enough so the performance is not dominated by static startup overheads (though this is application dependent). Ways to do this potentially include, for example: using a smaller number of time steps, restricting the number of SCF cycles, restricting the number of optimisation steps.
- Use basic benchmarking to help define the best resource use for your application. One useful strategy: take the core count you are using as the baseline, halve the number of cores/nodes and rerun and then double the number of cores/nodes from your baseline and rerun. Use the three data points to assess your efficiency and the impact of different core/node counts.
Key Points
To use resources effectively, you need to understand the performance of your jobs.
